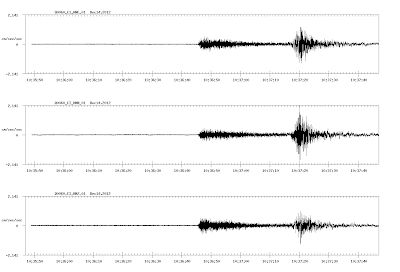
Early this morning (2:36:02 Pacific time, 10:36:02 UTC) there was a fairly large earthquake (6.3 magnitude) off the coast of northern Mexico. The epicenter was 305 km (about 183 miles) SW of our home. At that distance, of course we never felt a thing. But...the USGS requested data from the seismograph they installed in our home, and the graph at right shows what it “saw”.
This is the first seismogram I've ever actually tried to read. I found several articles about reading them; this was the most useful. If I'm understanding this correctly, I'm seeing the P-waves reaching us at about 10:36:46 UTC, or 44 seconds after the quake actually occurred. That works out to a speed of 305/44, or 6.93 km/s – fast for a P-wave. Then I'm seeing the S-waves reaching us at about 10:37:17 UTC, or 75 seconds after the quake actually occurred. That works out to a speed of 4.07 km/s – again fast for an S-wave. From what I've been reading, these seismograms are very challenging to extract good information from – both the amplitude and the timing of them are highly dependent on the geologic structures and material types between the earthquake and the seismometer. I think I'll leave that to the experts :-)
But I do think it's kind of cool to be able to see the earthquake on an instrument in my house!


No comments:
Post a Comment